South Asia Trade in 2023: A $1.1 Trillion Market with a Deep Goods Deficit
South Asia''s total trade reached $1.14 trillion in 2023, with a merchandise
``markdownSouth Asia Trade in 2023: A $1.1 Trillion Market with a Deep Goods Deficit and Surprising Service Strength
Introduction: The $1.14 Trillion Paradox
In 2023, South Asia’s total merchandise and services trade reached $1,137,367 million — a figure that places the region among the world's most dynamic but structurally uneven trade corridors. While the headline number suggests a robust economic engagement with global markets, the composition tells a more complex story. Goods exports stood at $444 billion against imports of $693 billion, yielding a merchandise trade deficit of $249 billion. Yet, when services are added to the ledger, a striking counter-narrative emerges: the region posted a net service surplus of $158.9 billion, with services exports of $357.7 billion dwarfing imports of $198.8 billion.
This dual-speed economy — a heavy importer of physical goods and a rising exporter of knowledge-based services — defines South Asia’s trade landscape in 2023. The structural mismatch is not merely a statistical curiosity; it reflects deep-seated patterns in industrial capacity, energy dependence, and comparative advantage. India dominates the services surplus, powered by IT outsourcing, software exports, and business process outsourcing (BPO), while smaller economies like Bangladesh and Pakistan struggle with persistent goods deficits driven by energy imports and machinery. This article unpacks the dimensions of that imbalance, examines the hidden technology and outsourcing trends behind the service surplus, and explores why investors and policymakers should pay close attention to South Asia’s shift toward digital and knowledge-based trade. Data is sourced from WITS (World Bank) and UNSD Comtrade, with the latest updates through March 2026, supplemented by World Development Indicators (WDI) and balance-of-payments statistics.
[IMAGE: Bar chart comparing goods trade balance vs. services trade balance for South Asia 2023 — blue bars for goods deficit, green bars for services surplus; sourced from WITS and UNSD Comtrade data.]
Goods Trade: The Heavy Importer's Burden
South Asia’s goods trade in 2023 reveals a region deeply reliant on foreign supply chains. Monthly goods imports averaged $76.3 billion, while exports averaged just $34.2 billion, producing a monthly deficit of $42 billion. Over the full year, total goods imports reached $693 billion against $444 billion in exports. Imports of goods and services together accounted for 23.15% of regional GDP, whereas exports were only 20.52% — a gap that underscores heavy dependence on foreign energy, machinery, and raw materials. The merchandise trade deficit of $249 billion represents approximately 7–8% of the region’s combined GDP, a level that pressures foreign exchange reserves and currency stability, particularly in net importers like Pakistan and Bangladesh.
The composition of imports follows a familiar pattern for developing Asian economies. Crude oil and petroleum products constitute the single largest import category, with South Asia importing over 80% of its oil consumption. Electronics and electrical machinery rank second, driven by India’s demand for smartphones, semiconductors, and capital equipment for manufacturing. Other major import categories include chemicals, plastics, and precious stones (especially gold for India and jewelry inputs for Bangladesh). On the export side, textiles and garments remain the backbone — Bangladesh, India, Pakistan, and Sri Lanka together supply a significant share of the world’s readymade garments, home textiles, and yarn. Agricultural products such as rice, tea, spices, and fruits also feature prominently, along with pharmaceuticals, leather goods, and engineering products (mainly from India).
The data from WITS and UNSD Comtrade — using FOB export valuation and CIF import valuation — provide granular monthly and annual breakdowns. Notably, the monthly import bill exceeded $70 billion in every quarter of 2023, while exports never breached $40 billion in any single month. This persistent structural deficit makes South Asia vulnerable to global commodity price shocks and foreign capital flow reversals. However, the goods deficit is only one side of the ledger.
[IMAGE: Pie chart showing top 5 import and export categories for South Asia in 2023 — based on typical profile: imports: crude oil, electronics, chemicals, machinery, gold; exports: textiles, garments, pharmaceuticals, agricultural products, leather.]
Services Trade: The Hidden Engine
If goods trade presents a picture of dependency, services trade offers a counterweight of surprising strength. In 2023, South Asia’s services exports reached $357.7 billion, nearly double the $198.8 billion in services imports, resulting in a net surplus of $158.9 billion. This surplus partially cushions the $249 billion goods deficit, reducing the overall current account deficit to roughly $90 billion — a manageable level for the region as a whole.
The primary driver of this service surplus is India, which accounts for more than 85% of the region’s services exports. India’s information technology (IT) and business process outsourcing (BPO) sectors alone generated over $200 billion in export revenue in 2023, according to data from the Reserve Bank of India and World Bank BOP statistics. The composition includes computer software and services (70%), consulting and professional services (15%), financial services (8%), and travel and tourism (7%). Other South Asian countries, while smaller in absolute terms, also contribute: Bangladesh’s IT freelancing sector has grown rapidly, Pakistan’s software exports crossed $3 billion, and Sri Lanka’s tourism recovery boosted its service receipts.
The service surplus signals a structural shift toward a knowledge-based economy. This trend is attracting foreign direct investment (FDI) in digital infrastructure, edtech, fintech, and telecommunications. Global tech giants have established large development centers in Bengaluru, Hyderabad, and Pune, while venture capital flows into South Asian startups — particularly in India — have soared. The World Development Indicators (WDI) show that service exports as a share of total exports in South Asia rose from 28% in 2015 to 44% in 2023, reflecting a rapid transformation.
However, the service surplus is not without vulnerabilities. It is heavily concentrated in a few subsectors and geographies; a slowdown in global IT spending or a shift toward onshoring (as seen in post-pandemic reshoring trends) could erode this buffer. Moreover, services surpluses do not directly offset goods deficits in the same currency flow, and many South Asian countries still run current account deficits. Nevertheless, the trend is clear: South Asia is becoming a services powerhouse.
[IMAGE: Line graph showing growth of South Asia service exports vs. service imports from 2019 to 2023 — exports rising from $280B to $357.7B, imports from $170B to $198.8B, with a widening surplus. Data source: WDI and BOP statistics.]
Implications for Trade Policy and Investment
The dual trade profile of South Asia — a deep goods deficit coupled with a robust service surplus — carries significant implications for trade policy, macroeconomic management, and investment strategies.
For trade policy, the persistent goods deficit pressures currencies and current accounts, especially for economies like Pakistan and Bangladesh that have limited service export capacity. These countries must either boost goods exports (via textile upgrading, light manufacturing diversification, or agricultural value addition) or reduce import dependency (through energy efficiency, domestic production of intermediates, or regional trade integration). The South Asian Free Trade Area (SAFTA) remains underutilized, with intra-regional trade accounting for less than 6% of total trade. Bilateral agreements, such as the India–Bangladesh Comprehensive Economic Partnership Agreement (CEPA) under negotiation, could reduce trade costs but must address non-tariff barriers and infrastructure gaps. Meanwhile, India, with its service surplus advantage, can afford to liberalize goods imports while investing in digital trade facilitation — a model that benefits the entire region.
For investors, South Asia’s trade structure offers a dual opportunity. On the goods side, sectors like textiles, pharmaceuticals, and engineering present export growth potential, particularly as global supply chains seek alternatives to China (the “China+1” strategy). Bangladesh’s garment sector, despite headwinds from rising wages and energy costs, remains competitive due to scale and preferential market access. India’s pharmaceutical exports, already the third-largest globally, benefit from generic drug demand. On the services side, IT outsourcing, BPO, fintech, and edtech are high-growth sectors attracting significant FDI. Recent data from UNCTAD shows that FDI inflows into South Asia reached $49 billion in 2023, with India capturing over 80% — and a growing share targeting digital services and e-commerce.
For macroeconomic stability, the service surplus offers a critical buffer. Central banks in the region can use service export earnings to manage currency volatility and finance essential goods imports. However, the service surplus is cyclical — tied to global growth cycles — and cannot replace structural reforms needed to narrow the goods deficit. South Asian governments should invest in skill development (especially in digital literacy and STEM), telecom infrastructure (5G and fiber optic), and trade facilitation (paperless customs, single-window systems) to further boost service exports.
For regional cooperation, the divergence between goods-deficit and service-surplus countries suggests a potential win-win integration. India can provide IT services and digital platforms, while smaller economies supply manufactured goods and agricultural produce. By liberalizing intra-regional trade in services (e.g., mutual recognition of qualifications, cross-border data flows), South Asia could replicate the model seen in ASEAN, where services trade supports manufacturing supply chains.
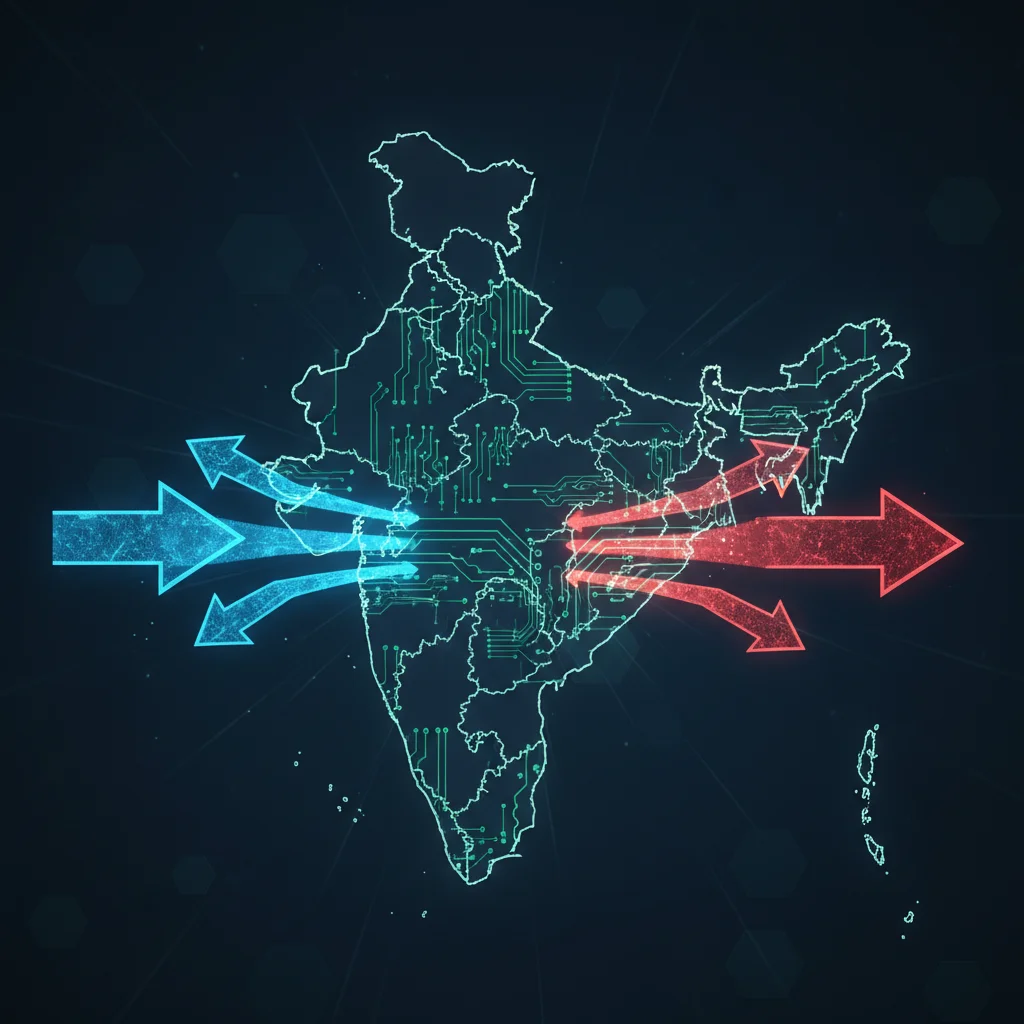
[IMAGE: Map of South Asia with arrows indicating trade flows — blue arrows for goods imports from East Asia and Middle East, red arrows for goods exports to West and Europe; green digital symbols for service exports from India. Data-driven infographic style.]
Conclusion: A Region in Transition
South Asia’s trade in 2023 reveals a region caught between two worlds: a heavy importer of physical goods dependent on global commodity markets, and a rising exporter of digital services that is carving out a competitive niche in the knowledge economy. The $249 billion goods deficit is a structural challenge that demands diversified manufacturing, energy reform, and deeper regional integration. Yet the $158.9 billion service surplus, driven by IT outsourcing and BPO, offers both a buffer and a direction for future growth.
For investors and policymakers, the message is clear: South Asia is not a monolithic market. Its trade profile is dual-speed, and investment strategies must reflect that complexity. The region’s success in navigating the transition from goods-dependent to knowledge-based trade will determine its place in the global economy over the next decade. As digital infrastructure expands and digital skills deepen, the service surplus may continue to widen — but only if accompanied by policies that address the goods deficit without undermining competitiveness.
Data from WITS (World Bank), UNSD Comtrade, and WDI — all updated through March 2026 — paint a picture of a region on the move. South Asia trade in 2023 was not just about numbers; it was about the structural forces shaping the world’s most populous economic zone. Watching the service surplus grow may be the most telling indicator of all.
[IMAGE: Infographic summarizing key figures: Total trade $1.14T, Goods deficit $249B, Service surplus $158.9B, Top export categories (textiles, IT services), Top import categories (oil, electronics). Include source logos for WITS and UNSD Comtrade.]
``