Delhi''s Vehicle Boom: 87.61 Lakh Registrations & a 522/1000 Ratio – What''s
Delhi's vehicle registrations surged to approximately 87.61 lakh in 2025-26,
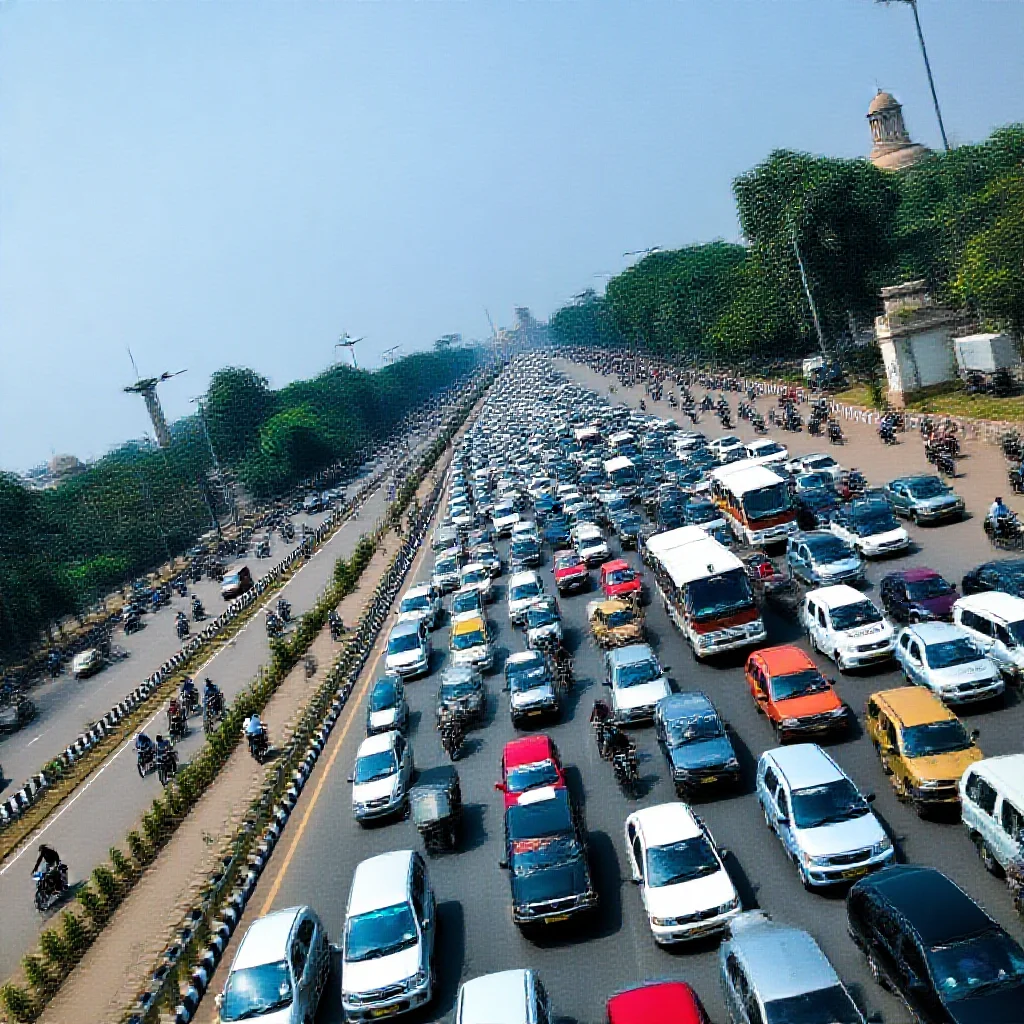
Delhi's Vehicle Boom: 87.61 Lakh Registrations & a 522/1000 Ratio – What's Driving the Surge and Can the City Cope?
Opening Summary
The vehicular landscape of Delhi has reached a new statistical milestone. Data for the 2025-26 financial year indicates the total number of registered vehicles in the national capital has risen to approximately 87.61 lakh (Source 1: [Primary Data]). This marks a significant increase from the 81.18 lakh vehicles registered in the previous financial year. A more revealing metric, however, is the vehicle-to-population ratio, which stood at 522 per thousand people as of March 19, 2026 (Source 2: [Density Metric]). This figure translates to more than one vehicle for every two residents, encapsulating a profound urban mobility and management challenge that extends beyond simple growth figures.
The Headline Numbers: Decoding Delhi's 2025-26 Vehicle Surge
The core data reveals a 6.4% annual growth in Delhi's vehicle fleet, adding roughly 6.43 lakh new registrations in a single year. This growth rate, when sustained, points to a compounding effect that strains existing urban planning models. The transition from 81.18 lakh to ~87.61 lakh vehicles is not an isolated event but part of a persistent upward trajectory.The critical analytical lens is the vehicle-to-population ratio of 522 per thousand. This density metric indicates a level of vehicle saturation that places Delhi among the most motorized urban centers globally. Comparative analysis shows this ratio significantly exceeds that of many European and Asian megacities with more established public transit networks. The figure moves the discussion from one of incremental growth to one of systemic saturation, questioning the capacity of urban infrastructure to absorb further expansion. This data aligns with the historical timeline of Delhi's transport policy releases, where growth has consistently outpaced the implementation of restrictive or alternative measures.
Beyond Growth: The Hidden Economic and Behavioral Drivers
The surge is driven by a confluence of economic and behavioral factors. Post-pandemic economic recovery has likely released pent-up demand for personal mobility, perceived as safer and more reliable than shared transport. This is compounded by a structural gap: the expansion of the Metro and bus networks has not kept pace with the city's spatial growth or provided last-mile connectivity sufficient to deter private vehicle ownership.On the supply side, deep penetration of auto-finance, aggressive dealership networks extending into peripheral areas, and a booming organized used-car market have dramatically lowered barriers to vehicle acquisition. Ownership has become financially accessible to a broader demographic. A paradoxical trend emerges from environmental policy: the push for electric vehicles (EVs), while crucial for emissions, appears to be contributing to net addition to the vehicle fleet. Early data suggests EVs are supplementing, not replacing, internal combustion engine vehicles for many households, driven by separate use-case justifications and affordable financing, thus accelerating total fleet growth.
The Infrastructure Tipping Point: What a 522 Ratio Really Means for Delhi
A ratio of 522 vehicles per thousand population represents a direct stress test for urban systems. The physical implications are calculable: severe parking scarcity, escalating road maintenance costs due to wear-and-tear, and exponential complexity in traffic management. The economic cost of congestion, in terms of fuel waste and lost productivity, becomes a significant drag on the city's economy.From a public health perspective, the growing fleet presents a persistent challenge to air quality management. While industrial and dust sources are regulated, the continuous addition of vehicles—even a growing share being electric—does not reduce non-exhaust particulate matter (PM2.5, PM10) from brake and tire wear. The focus on tailpipe emissions alone is an incomplete solution. For urban planning, this data serves as a quantitative verdict on the limited success of transit-oriented development (TOD). The high vehicle density indicates that land-use and transportation planning remain inadequately integrated, forcing reliance on private vehicles.
Policy Crossroads: Can Regulation Keep Pace with Registration?
Current regulatory measures, including proposed congestion charges and parking management policies, are designed for a fleet size and growth rate of the past. Their effectiveness is now questionable against an annual increment of over 6 lakh vehicles. Regulations focusing on vehicle ownership, such as increased taxes or lottery systems, face significant political and public resistance.A logical deduction points to a necessary shift in policy focus: from restricting vehicle ownership to managing vehicle usage. This involves leveraging technology for dynamic congestion pricing, creating substantive disincentives for single-occupancy commutes, and providing tangible, reliable alternatives for all trip purposes. The data necessitates a move from slow, periodic analysis to real-time, adaptive traffic and demand management systems. Future scenario modeling indicates that if the current growth rate continues unabated, the vehicle-to-population ratio will approach 600 per thousand within the next five years, a scenario for which no Indian city has a functional blueprint.
Neutral Market and Urban System Predictions
Based on the trajectory, the automotive retail and finance sectors in the National Capital Region are projected to maintain strong growth in the short to medium term, fueled by accessible financing and continuous model launches. The used-car market will see increased formalization and valuation stability. Conversely, the infrastructure support sector—including parking solutions, traffic management technology, and EV charging networks—will face intense demand pressure, likely driving innovation and investment in these areas.The long-term urban system prediction hinges on policy intervention. In the absence of drastic, technology-enabled usage management, Delhi will approach a state of gridlock where the marginal utility of owning an additional vehicle becomes negative due to extreme congestion and parking unavailability. This will create a natural, albeit painful, market correction. The alternative path requires a systemic re-engineering of mobility, prioritizing access over ownership, which would reshape the automotive market's relationship with the megacity. The 2025-26 registration data is not merely a statistic; it is a leading indicator of which of these two futures is being actively constructed.